February 12, 2022:
- Updated the example and the repository to usestream_with_context()which stops the generator after a client browser has been disconnected.
- Add headers to make it work behind a proxy server likenginx
- Deployed a working demo at https://chart.ron.sh/
Creating charts that update automatically is one common use case that web developers commonly implement. With this, HTTP polling is commonly used wherein the client sends a request to the server. Another method is to use WebSockets.
Server-Sent Events (SSE)
Server-Sent Events is another way of pushing updates to a client. The difference between WebSockets and SSE is that a WebSocket is two-way while SSE is a one-way communication. SSE is optimum for pushing notifications to the client since there is no requirement of sending back messages to the server in real-time.
SSE in Flask
To implement SSE in a Flask server, it is only needed to stream data using a generator and set mimetype to text/event-stream.
# generate_random_data() is a generator
return Response(stream_with_context(generate_random_data()), mimetype="text/event-stream")
SSE in Browsers (Javascript)
To implement SSE in a browser, instantiate an EventSource and bind a function to the onmessage event.
const source = new EventSource("<URL>");

source.onmessage = function (event) {
   # use event parameter
}
Implementing Real-Time Charts Using SSE
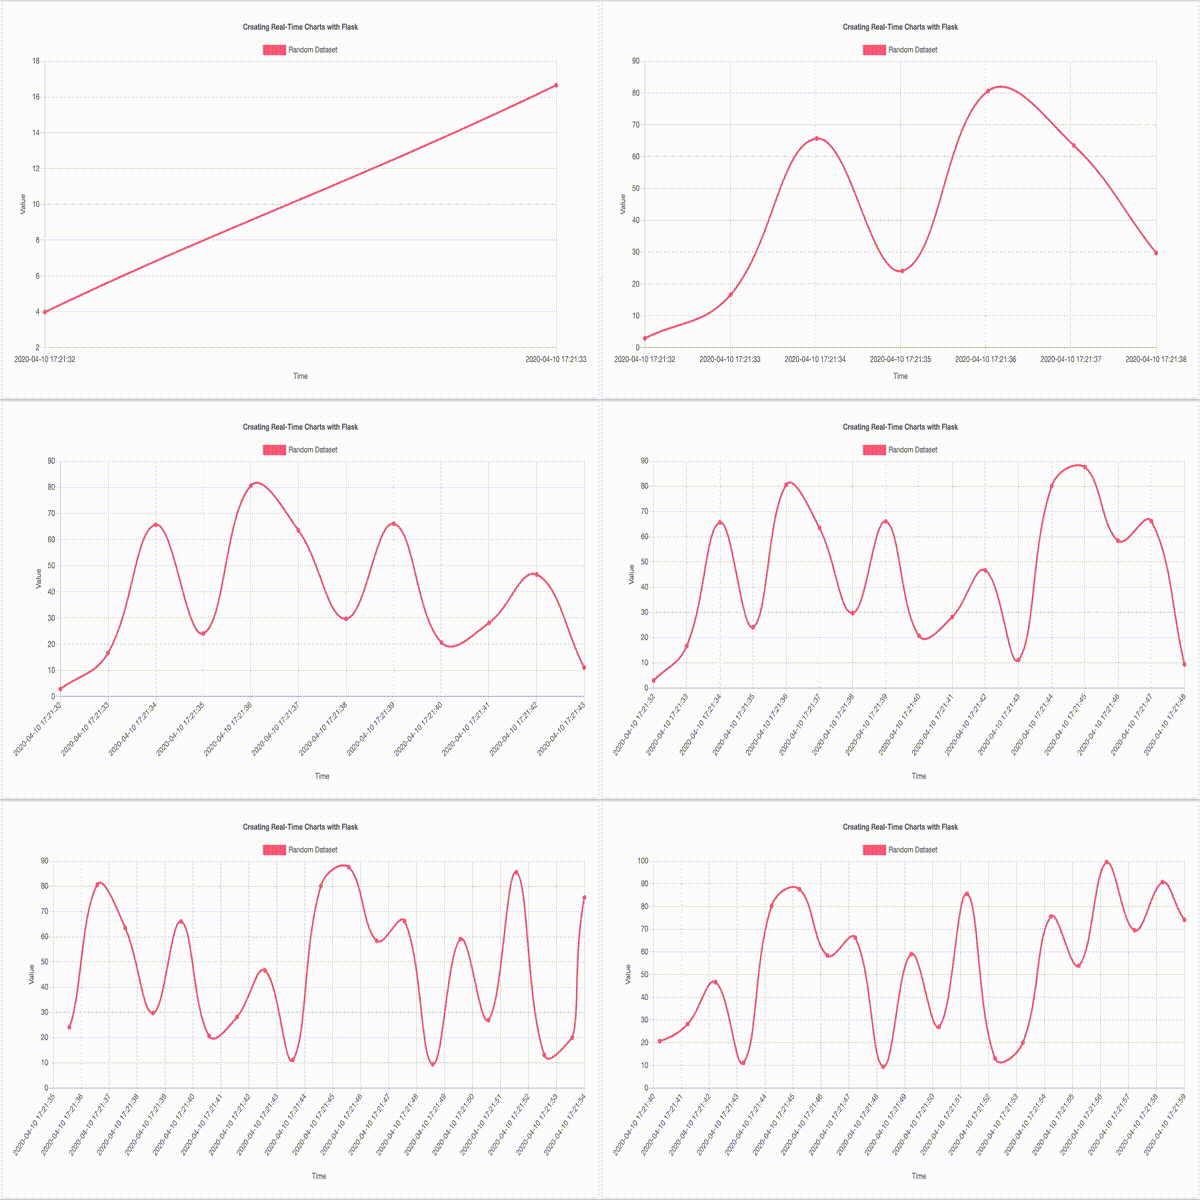
In this example, we will use Flask and Chart.js. The code below shows our Flask server implementation. generate_random_data() yield values from 0 to 100 and the current timestamp.
import json
import random
import time
from datetime import datetime

from flask import Flask, Response, render_template, stream_with_context

application = Flask(__name__)
random.seed()  # Initialize the random number generator


@application.route('/')
def index():
    return render_template('index.html')


@application.route('/chart-data')
def chart_data():
    def generate_random_data():
        while True:
            json_data = json.dumps(
                {'time': datetime.now().strftime('%Y-%m-%d %H:%M:%S'), 'value': random.random() * 100})
            yield f"data:{json_data}\n\n"
            time.sleep(1)

    response = Response(stream_with_context(generate_random_data()), mimetype="text/event-stream")
    response.headers["Cache-Control"] = "no-cache"
    response.headers["X-Accel-Buffering"] = "no"
    return response


if __name__ == '__main__':
    application.run(debug=True, threaded=True)
The code below shows how easy it is to update charts. We used Twitter Bootstrap to easily manage the page style. First, we instantiate the Chart and EventSource objects. Then on the onmessage event, we parse the JSON data pushed by the server and update our chart array.
<!DOCTYPE html>
<html lang="en">
<head>
    <meta charset="UTF-8">
    <title>Creating Real-Time Charts with Flask</title>
    <link href="https://cdnjs.cloudflare.com/ajax/libs/twitter-bootstrap/4.3.1/css/bootstrap.min.css" rel="stylesheet">
    <link href="https://cdnjs.cloudflare.com/ajax/libs/Chart.js/2.8.0/Chart.min.css" rel="stylesheet">
</head>
<body>
<div class="container">
    <div class="row">
        <div class="col-12">
            <div class="card">
                <div class="card-body">
                    <canvas id="canvas"></canvas>
                </div>
            </div>
        </div>
    </div>
</div>
<!--suppress JSUnresolvedLibraryURL -->
<script src="https://cdnjs.cloudflare.com/ajax/libs/jquery/3.4.0/jquery.min.js"></script>
<!--suppress JSUnresolvedLibraryURL -->
<script src="https://cdnjs.cloudflare.com/ajax/libs/twitter-bootstrap/4.3.1/js/bootstrap.min.js"></script>
<!--suppress JSUnresolvedLibraryURL -->
<script src="https://cdnjs.cloudflare.com/ajax/libs/Chart.js/2.8.0/Chart.min.js"></script>
<script>
    $(document).ready(function () {
        const config = {
            type: 'line',
            data: {
                labels: [],
                datasets: [{
                    label: "Random Dataset",
                    backgroundColor: 'rgb(255, 99, 132)',
                    borderColor: 'rgb(255, 99, 132)',
                    data: [],
                    fill: false,
                }],
            },
            options: {
                responsive: true,
                title: {
                    display: true,
                    text: 'Creating Real-Time Charts with Flask'
                },
                tooltips: {
                    mode: 'index',
                    intersect: false,
                },
                hover: {
                    mode: 'nearest',
                    intersect: true
                },
                scales: {
                    xAxes: [{
                        display: true,
                        scaleLabel: {
                            display: true,
                            labelString: 'Time'
                        }
                    }],
                    yAxes: [{
                        display: true,
                        scaleLabel: {
                            display: true,
                            labelString: 'Value'
                        }
                    }]
                }
            }
        };

        const context = document.getElementById('canvas').getContext('2d');

        const lineChart = new Chart(context, config);

        const source = new EventSource("/chart-data");

        source.onmessage = function (event) {
            const data = JSON.parse(event.data);
            if (config.data.labels.length === 20) {
                config.data.labels.shift();
                config.data.datasets[0].data.shift();
            }
            config.data.labels.push(data.time);
            config.data.datasets[0].data.push(data.value);
            lineChart.update();
        }
    });
</script>
</body>
</html>
What's next?
This approach can also be implemented using other popular client-side charting libraries. Handling multiple charts at the same time, should be pretty straightforward.
Sample application is available on Github.


